A scenario simulation tool for greener decision making

Team Structure
2 UI/UX Designers
1 Product Manager
1 Design Researcher
1 Software engineer
Platform
Desktop
Time Frame
Jan. 2022 - Mar. 2022
Responsibilty
UI/UX Design, Strategy Design
✦ Context
Can a company be both sustainable🌱 and generate decent revenue💰?
At SMBC Aviation Capital, we are committed to finding solutions on this. In this project, we'll explore how our team has proposed a redesigned aircraft leasing solution for, allowing SMBC AC to lead the aviation industry in being both green and profitable.

✦ The Problem
What challenges do airline decision-makers face when choosing sustainable options?
Airline decision-makers often struggle to advocate for sustainability needs due to a lack of clear, flexible, and data-driven tools that help them balance financial, operational, and environmental trade-offs.

✦ Current experience overview
Preliminary journey mapping of airline’s leasing processes with SMBC AC
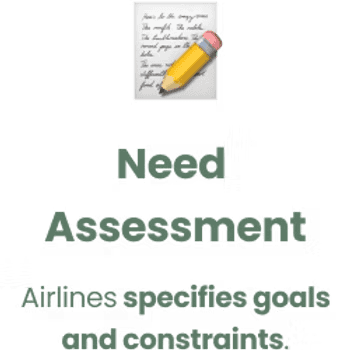
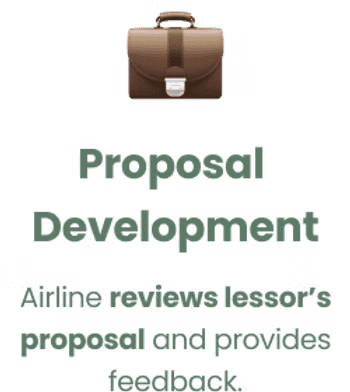
Let’s take a quick look at the current leasing process and how airlines sign contracts with us. It might sound complicated and intimidating at first, but it could be pretty similar to leasing a car. It starts with the airline reaching out to express interest. From there, the lessor checks in to understand their needs, then offers a proposal. After a few rounds of negotiation to make sure everything aligns, the deal is sealed with a signed contract!


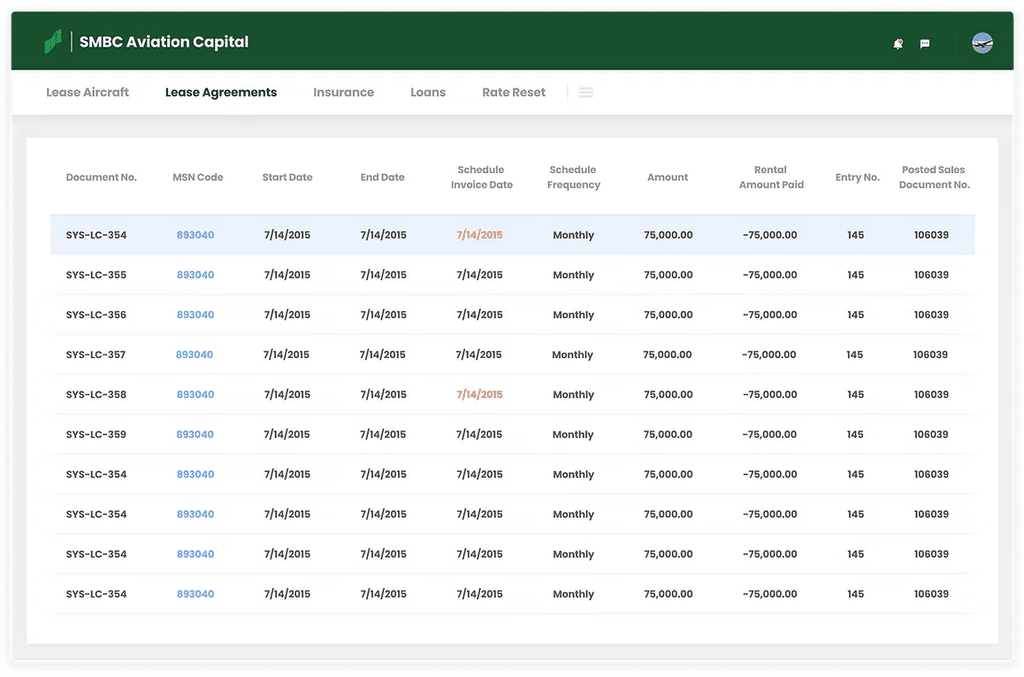
An overview of current experience in the leasing system
Allowing airlines to track assets and leases in real-time from anywhere.
Note: Data displayed is fictional for confidential purposes.

Providing detailed views of lease agreements, enabling airlines to access up-to-date leasing information.
Note: Data displayed is fictional for confidential purposes.
✦ The Users
Who're the major stakeholders in the leasing processes?
On the airline side, the Strategic Fleet Manager is the most crucial player when it comes to deciding which lease agreement to sign. They’re responsible for fleet planning and optimization to keep operations running smoothly. Then there’s the Finance Manager, who handles pricing, and the Sustainability Manager, who ensures the leasing agreement aligns with the airline’s sustainability goals. Alongside them, you have the Procurement Manager, overseeing the process, and Legal Advisor who provides legal guidance.

To dive deeper into this, here’s a journey map I created to break down the key tasks and pain points for them. As you can see, the Strategic Fleet Manager and Finance Manager interact closely on tasks like receiving the contract, assessing the budget, providing fleet requirements, reviewing cost implications, and then giving feedback for negotiations and finalization.

(Hover it)
They’re the primary decision-makers, while the Sustainability Manager mainly offers suggestions, advocates for sustainability, and reviews proposals, but doesn’t have as much influence. This is also where I see the problem, in the end, decisions tend to be driven mostly by business considerations.
✦ Insight Summery
So, where’s our opportunity based on what I discovered?
I found that the Sustainability Officer is often left out of the decision-making process. Meanwhile, Finance Managers are under constant pressure to cut costs, which means decisions usually end up being driven mostly by business factors.

✦ How Might We Questions
This leads to us questioning the new possibilites base on previous finding…
In simpler words, we need a solution to enhance collaboration, demonstrate the benefits of sustainability, and highlight lease flexibility.

(Hover it)
✦ Brainstorming & Prototyping
I worked with the PM to prototype and explore the possibilities.
We need a new feature to integrate into the airline's lease management system. We built our first information architecture for the solution, defining the functionality of the feature. It consists of two main sections:
Carbon Emissions Insight Section: Shows the airline's current carbon emissions status.
Leasing Plan Simulator: Recommends a more sustainable leasing option.


✦ Prototyping
From 0 to 1, diving in to design the solution
Through rounds of discussions and iterations, I developed wireframe and then a first version of the high-fidelity prototype for initial user testing.

In the first section, Emission Breakdown, the airline lease manager can:
Use tabs to explore various topics, such as emission intensity and year-over-year comparisons.
View estimated carbon emissions for their aircraft through a line chart displayed at the top.
See a pie chart that breaks down the sources of emissions.

(Hover it)
Now, we can look into the second section, the Leasing Plan Simulator.
The card layout provides a snapshot of the current status of the fleet leasing plan with SMBC.
The Filter feature allows airline staff to customize their search by inputting specific criteria such as sustainability goals, contract duration, or growth rate.
With the checkbox options for filtered fleet choices, users can select and compare multiple fleet leasing plans. This fulfills the objective of showcasing lease flexibility, providing intelligent options, and encouraging action.

(Hover it)
✦ User testing
We conducted early-stage user testing
With this prototype, we conducted early-stage user testing using a moderated usability testing method. We guided participants through the design and asked targeted questions.

✦ Test Result
Looking at the test results
8 airline staff said the carbon impact data improved their understanding, and 6 found it encouraged sustainable leasing. Many valued the visuals, with one noting it boosted confidence in advocating for greener decisions. Sustainability managers found it useful, reducing reporting time and filling gaps in their absence.

✦ Areas for Improvement
What are the negative feedback for improvement?
5 staff suggested more direct visualizations to show how leasing plans reduce carbon emissions. 3 staff requested insights into the long-term value of sustainable options.

✦ Iterated Information Architecture
Based on this feedback, we revisited the information architecture
We proposed combining the two sections for better cohesion. We rethought how to showcase the value each leasing plan contributes to decarbonization.
✦ Iterated wireframe
Combining into 1 Cohesive Leasing Plan Simulation Tool
Users will start with entering their fleet leasing requirements and goals, then compare options using visualization that estimated carbon emissions over time. The next step is to provide recommendations and insights for each option. Finally, users can generate a detailed report with a single click.


✦ Iterated userflow
Layout Limitation Restricting Scenario Comparison
However in this user flow, the design occupies significant space and restricts users to comparing only three scenarios, limiting their ability to conduct a comprehensive analysis. Therefore we developed a new intuitive left to right structure, to add unlimited lease plan scenarios.


✦ Prototype Design
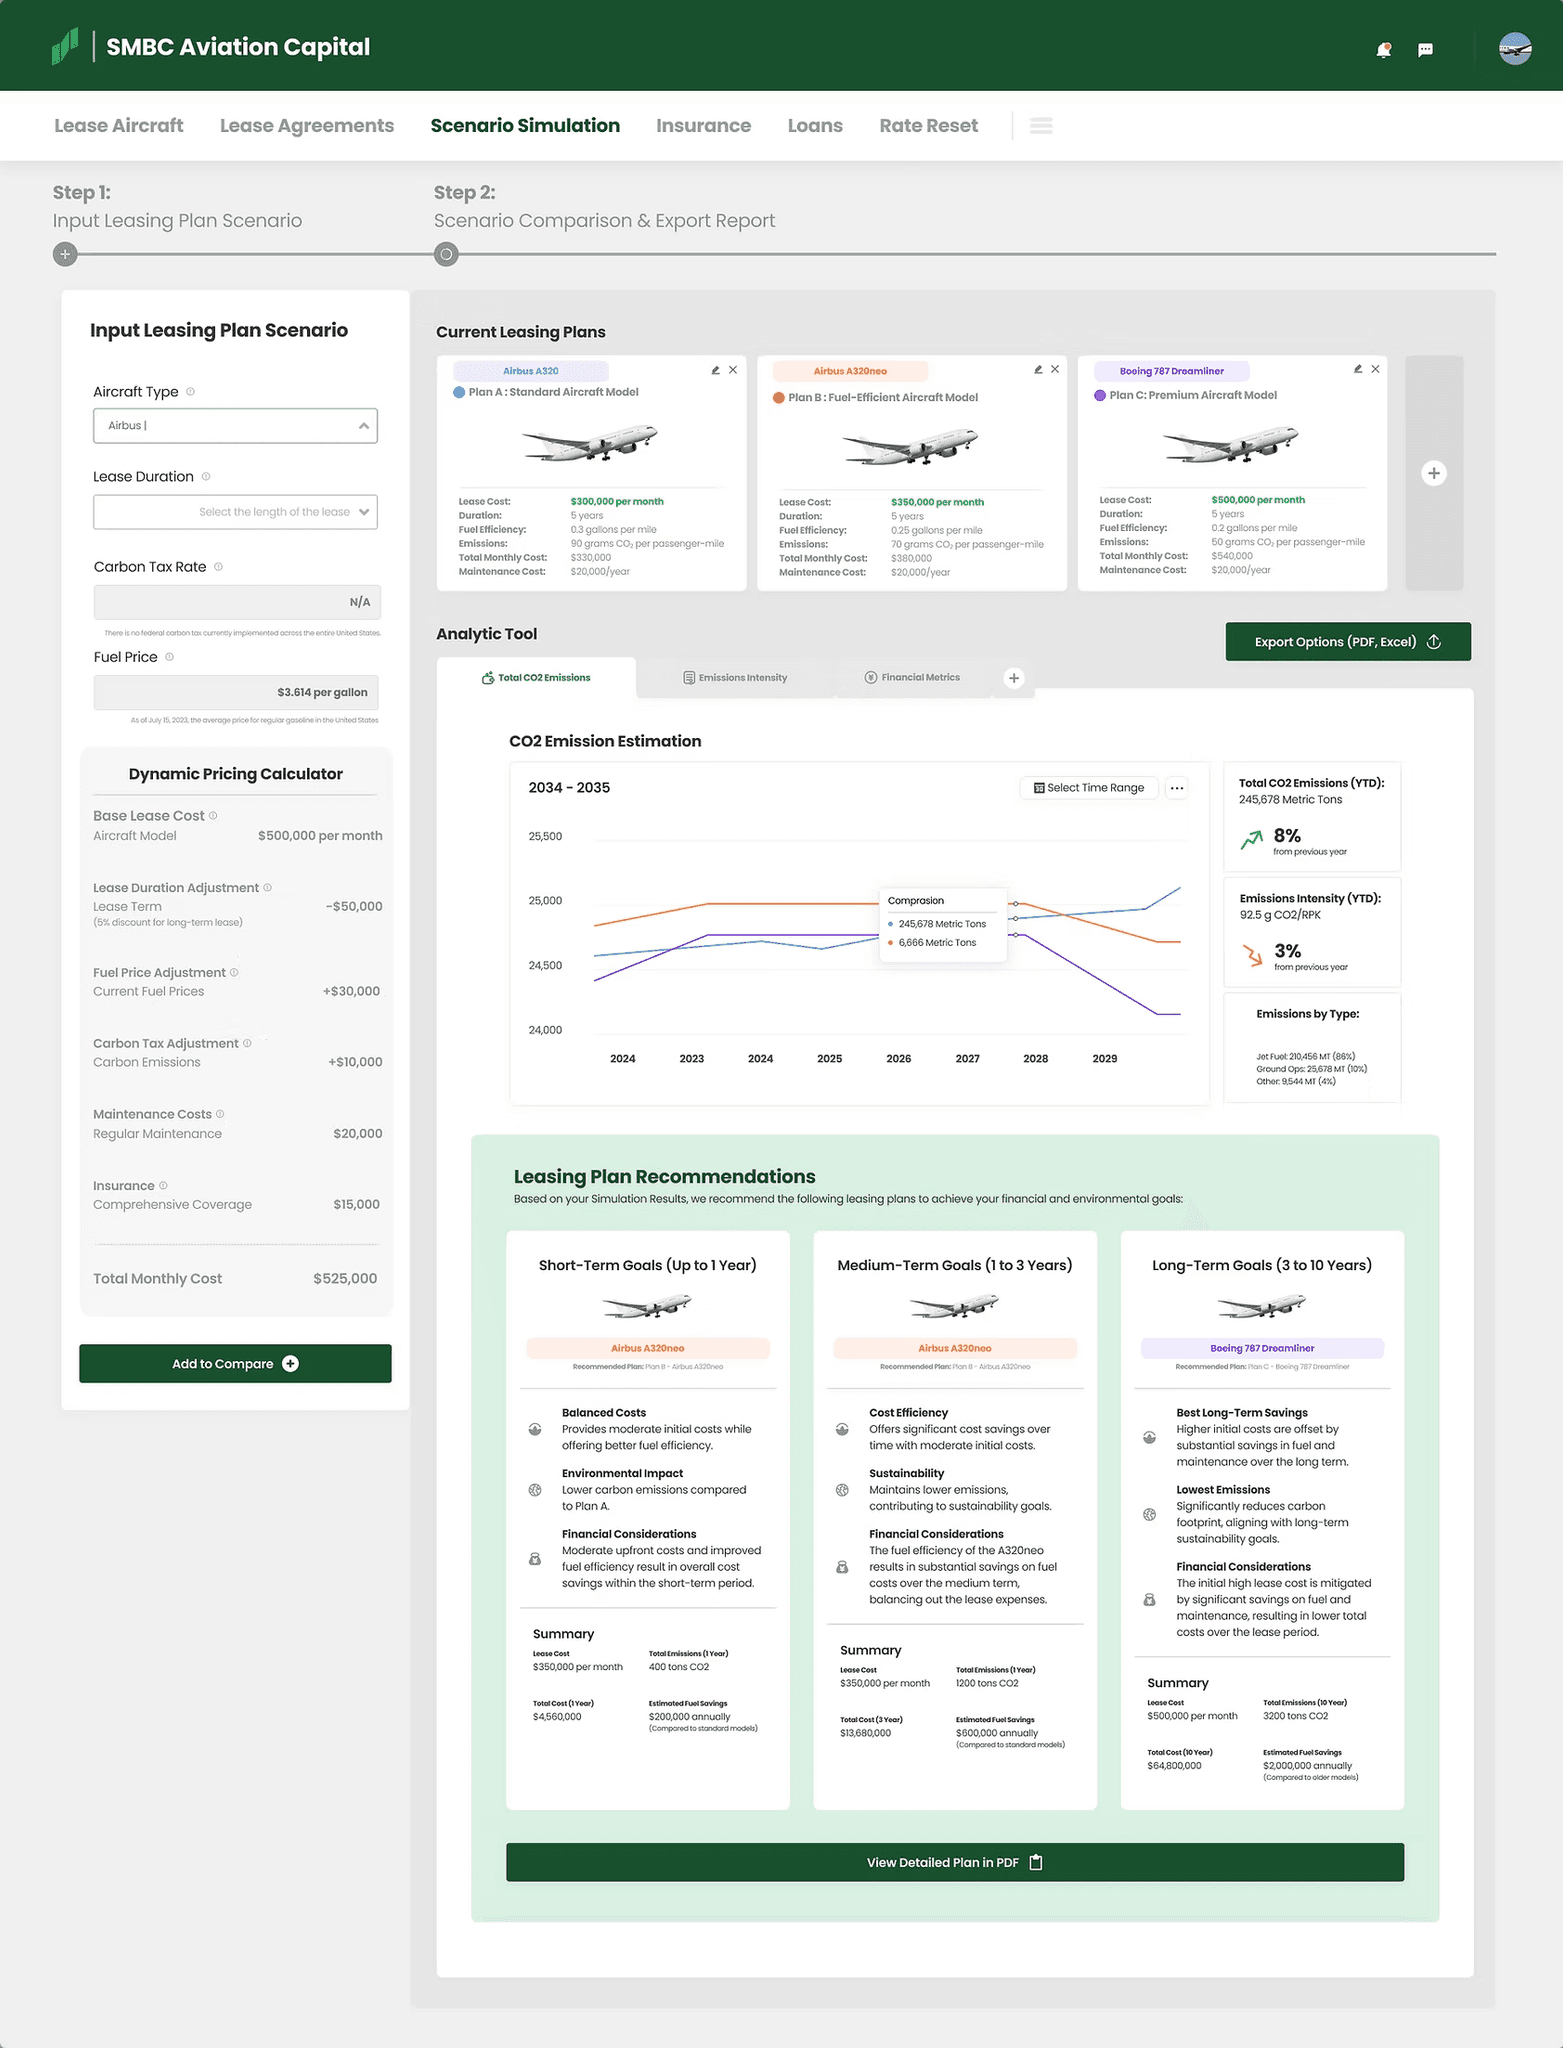
Section 1: The input section
Looking at the input section, It has been designed into two sections. The upper part is allowing the leasing manager to input their preferred options and compare leasing plans using dropdowns and input fields. While they are inputting the numbers, a live update of the estimated cost breakdown will appear immediately, allowing them to keep the total cost in mind. This input leasing plan scenario section will leveraged by AI/ML models to generate real-time cost estimates, therefor collaboration here I would like to highlight specifically.


✦ Prototype Design
Section 2: Lease plan scenario
Here we have the cards of the leasing plans you just added from the input fields, with assigned color tags displayed side by side for easy comparison. Moving to the Report section, which is where we provide lease managers with comparison data and offer recommendations. I'm keeping the tab bar to switch between data graphs, and users can add topics they’re interested in. Moving down to the visualization part, there’s a time range button that allows users to select a specific time range for detailed insights. In the graph, I designed tooltips for users to hover over and view details from different sources.


✦ Prototype Design
Section 3: Recommendations
By moving downwards, we have the recommendation card automatically generated by AI, presenting a brief report that provides insights and terms the leasing manager may need for internal communication.

✦ Collaboration
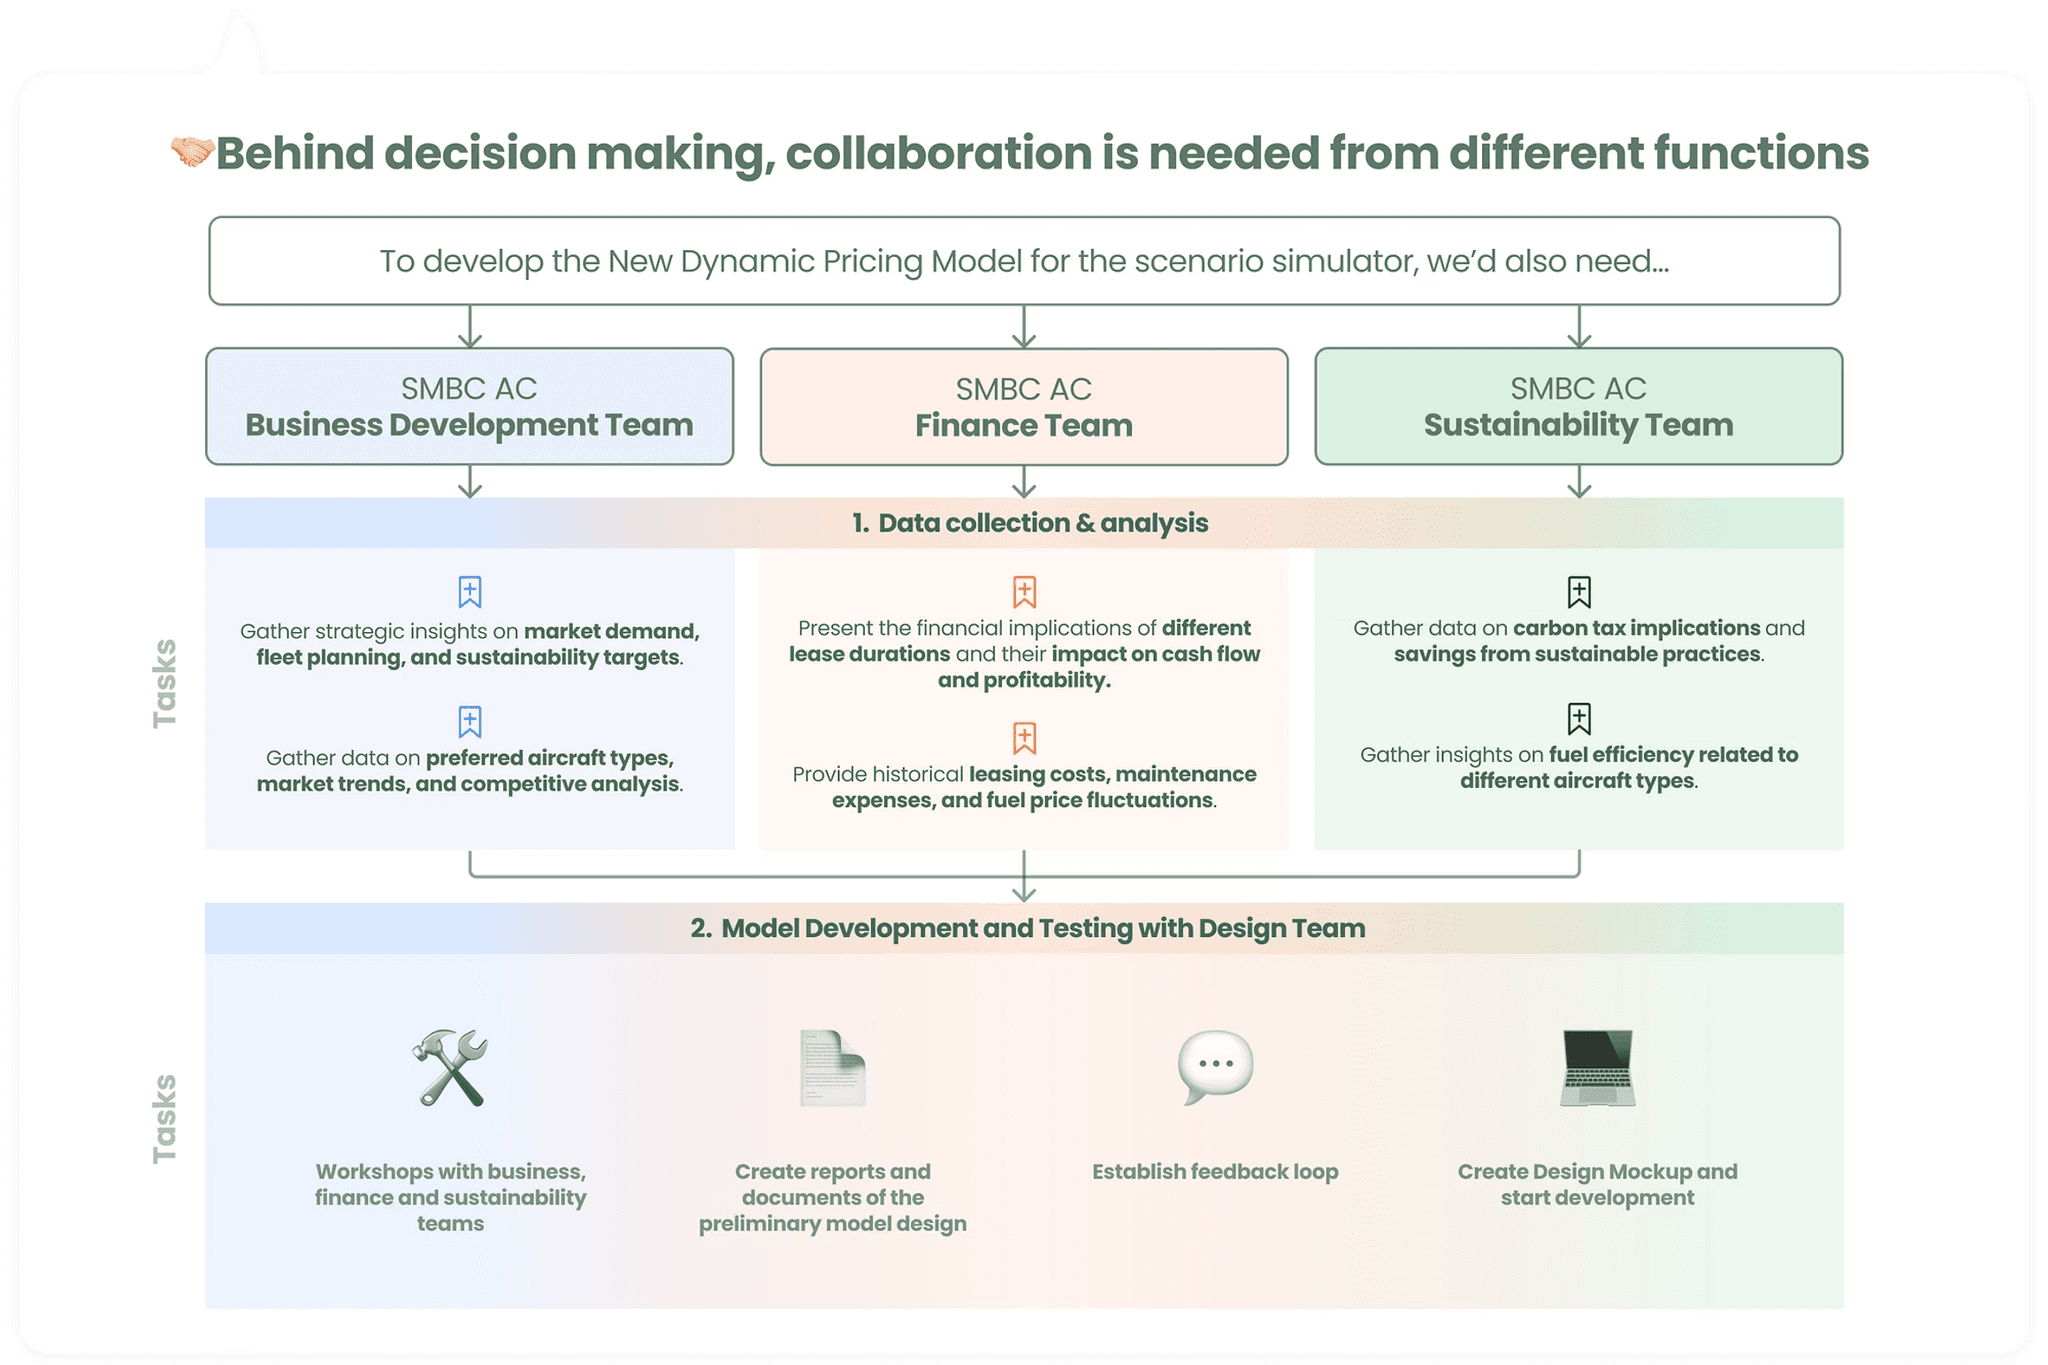
But achieving this won’t be a straightforward process...
Effective decision-making will require cross-functional meetings to develop the new dynamic pricing model for the scenario simulator from a strategic perspective.
✦ The Final Screens
In summary, we created 3 main sections within the Scenario Simulation Tool from 0 to 1.
✦ Impact
50% Reduction in Decision-Making Time
It streamlined the decision-making process by simplifying complex data. Our user testing shows airlines now benefit from a 50% reduction in the time required to evaluate and select leasing options, allowing them to act more swiftly and efficiently in response to market demands.
✦ Impact
40% increase in sustainable leasing options selected
By providing actionable insights into the impact of different leasing scenarios, our user testing shows airlines now have access to detailed analytics, enabling them to choose more sustainable leasing options that align with their environmental goals.
✦ What's Next
A/B Testing & Design Iterations
Up to this point, the design development for this new feature has reached its initial wrap-up. However, it will never be perfect. For the design, further A/B testing or usability testing is needed with initial launching, with a focus on gathering more quantitative data from a user experience perspective.
✦ My Takeaways
The Role of Qualitative Data in Early Product Strategy
In the early stages of a product’s lifecycle, especially for 0-to-1 products, qualitative data plays a crucial role. Through in-depth conversations and interviews, I was able to uncover the true pain points and needs of our users. These insights became the foundation for strategic decisions, ensuring the product was addressing real problems, not just assumptions.
The Shift to Quantitative Data in Design Refinement
As the product matured, the focus naturally shifted to refining the visual design and interaction details. At this stage, quantitative data became more critical. By conducting unmoderated usability tests with larger sample sizes, I was able to identify which UI components worked best in reducing user effort and improving the overall experience. It was about turning user feedback into actionable design improvements that made a tangible difference.
Prioritizing Business Goals in Design Decisions
This case study wasn’t just about improving the user experience—it was about ensuring the product aligned with SMBC’s business goals and value propositions. By focusing on the why—why the product exists, why it’s valuable, and how it supports the organization’s strategic objectives—I created a solution that not only resonated with users but also delivered measurable business impact.